This week’s Match of the Week in the Machineseeker EHF Champions League between Telekom Veszprém HC and Barlinek Industria Kielce is a clash of teams with different strengths. Kielce is the second best team in attack, scoring 30.1 goals per 50 possessions and are slightly better than average in defence with 27.8 goals conceded per 50 possessions.
In contrast, Veszprém’s strength is defence. 26.9 goals conceded per 50 possessions means they are second best. In attack, they are around average with 29.0 goals scored per 50 possessions.
Adjusting goals to the same number of possessions makes teams actually comparable, since the raw number of goals is not only influenced by efficiency but also by the number possessions (which indicates whether a team and their opponents plays fast or slow handball).
The details at team level
At team level, we can use common statistics to look at and find the reasons for these numbers on both sides of the court. In offense, Kielce is among the top teams in almost every statistic category. Among others, they are both third in shooting percentage (67.6 per cent) and turnovers (7.4 per 50 possessions).
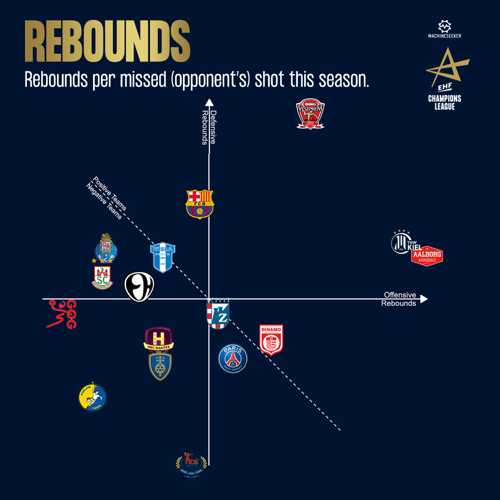
The Polish champion’s only flaw is that they receive the second fewest number of second chances (they recover only 13.9 per cent of their missed shots). In turn, second chances is the only offensive statistic where Veszprém really shine. Of their missed attempts they’re getting 20.6 per cent back, which is third best. The influence of the teams on second chances is, of course, limited.
Defensively, the details show that Kielce allow the second lowest shooting percentage (60.1 per cent), while Veszprém ranks fifth here (62.7 per cent). But Kielce forces barely any turnovers (7.5 per 50 possessions, forth lowest), while Veszprém is good here (9.0, fifth).
It’s again second chances that make a big difference. 88.8 per cent of the attempts Veszprém’s opponents miss end up in the hands of the Hungarians, which is clearly best in the competition. With 79.5 per cent Talant Dujshebaev’s team are second-last here as well.

For an even more in-depth look at the teams we can look at play-type statistics, where the statistics of teams and players are split by the type of play.
For example, in the playoff round, Veszprém was outstanding at wing shots, scoring eight goals in eight possessions that ended in a wing shot. However, that was only 6.7 per cent of their total possessions. In transition (first, second and third wave fastbreaks and fast throw-off) they scored 21 goals plus received one penalty in 26 possessions, which was the second-best amongst all eight playoff teams as well as the highest share (21.8 per cen).
The problems with evaluating player defence
At player level, evaluating attacking performance works relatively well using traditional statistics or play-type statistics. For instance, Rasmus Lauge was the only player who in both playoff legs had at least ten isolated possessions. In those he was very efficient scoring six goals and receiving one penalty.
For defence, however, at player level neither the traditional nor play-type statistics offer much. Actually, quantifying defence for players is almost impossible. Only steals, blocks and personal penalties exist as statistical categories. The only exception, of course, is the goalkeepers.
Actually, goalkeepers are the players that make the biggest difference. Their performances can easily be measured by save percentages or advanced methods such as goalkeeper efficiency. Interestingly, even though Veszprém’s defensive statistics are better overall, Kielce has the slight advantage in save percentage with 29.4 per cent saves by Andreas Wolff and Mateusz Kornecki versus 27.3 per cent by Rodrigo Corrales and Vladimir Cupara.
In this Machineseeker EHF Champions League season 14,643 possessions have been played. But besides goalkeeper statistics only 1,676 steals, blocks, two minute penalties and red cards have been annotated. So for just 11.4 per cent of all defensive possessions has an individual defensive statistic been tracked, while in attack there is at least one for every possession. In the other 88.6 per cent, players are obviously contributing in defence as well.
In addition, the three defensive statistics are barely meaningful themselves. All of them correlate heavily with playing time. As long as that or the number of possessions played is not available, an evaluation of suspension minutes is impossible.
In addition, stealing the ball is very dependent on the defensive system and whether the players are allowed to gamble to reach passes. In turn, if it’s unsuccessful, it leads to a hole in the defence and probably a good chance for the opponent. So, a player with many steals could even be considered a bad defender if he just tries to jump for the pass every time and misses mostly.
Blocks are not much more meaningful either. After 60.8% of all blocked shots the offensive team remains in possession. Defence is much more than just that. It's about standing correctly, not allowing the throw in the first place, or cooperating with the goalkeeper. All that’s (currently) immeasurable. As Albert Einstein once said: “Everything that can be counted does not necessarily count; everything that counts cannot necessarily be counted.”


