To evaluate goalkeeper performances, usually the percentage of shots saved from all shots that went on goal is used.
On this metric, Denmark’s Kevin Møller would be the best goalkeeper of the EHF EURO 2022 with a save percentage of 40.9 per cent, ahead of Sweden’s Peter Johannesson (39.1 per cent), fellow Swede Tobias Thulin and France’s Vincent Gerard (both 35.3 per cent). Only goalkeepers who received at least 30 shots on goal were considered.
Sometimes also the pure number of saves is used. In this case Russian Victor Kireev (75), Montenegro’s Nebojsa Simic and Gerard (both 61) would be the best.
But this of course has little meaning as it favours goalkeepers who are the clear number one and are on the field a lot. This is especially true for Simic, as he only saved 26 per cent of the shots on target. Goalkeepers who play less because they have a strong partner are in turn disadvantaged.
Expected saves
Evaluating goalkeepers using the save percentage also has flaws, because not every shot is equally difficult to save. Back-court shots, for example, are currently saved at a rate of 40.8 per cent at the EHF EURO 2022.
In contrast, the save rate for first wave fastbreaks is only 22.9 per cent. So, it is much harder for a goalkeeper to have a good save percentage if his team allows their opponents to shoot dozens of fastbreaks compared to frontmen that mainly allow well-defended shots from nine or more metres.
To account for such inequalities, goalkeepers can be evaluated based on the idea of expected goals (xG). xG is an approach that has prevailed in football analysis in recent years. It is basically the sum of the goal probability of each shot.
The statistical model to calculate these probabilities can include all information that is known at the moment of the shot such as the position, angle, play type, type of shot, distance to the closest defender and much more.
Expected goals are used to evaluate teams or players. One example is the average xG number per shot, which shows whether a team or player gets high quality shots or not. Another example is the ratio between goals and expected goals, which shows how efficiently chances are actually used.
To evaluate goalkeepers, only shots that go on goal are considered. In addition, information after the shot is taken can be taken into account, since goalkeepers face shots after they are taken.
This information includes shot speed or the location the shot goes to. These are called expected goals on target, or post-shot expected goals. The difference between this and the actual shots on goal are then the expected saves (xS).
For handball, currently only rough models exist since much of the data needed is not available yet. The model used here uses some of the tracking data provided by KINEXON, however the number of games and information available is not big enough yet to build models only based on this data.
The most efficient goalkeepers
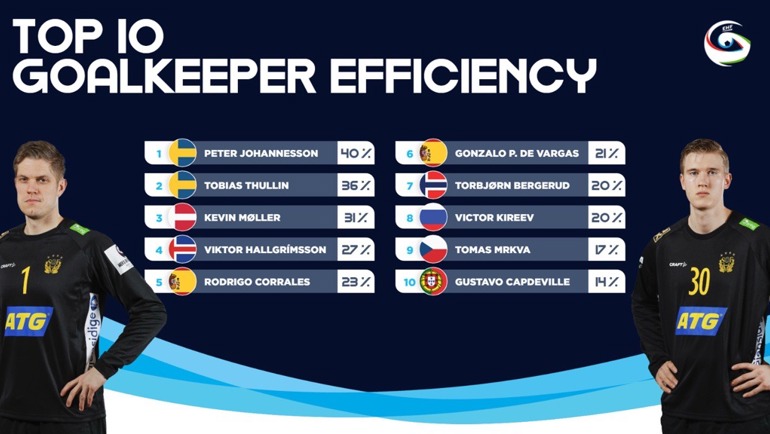
Therefore, a fairer and more meaningful method to rate goalkeepers is according to the percentage of actual saves they have made, compared to expected saves. The actual performance of the goalkeeper can be evaluated in this way independently of the performance of the defence in front of him.
A simple example is Norwegian Torbjoern Bergerud’s performance against Sweden two days ago. He only came on the field for five penalties and a shot after the rebound after a saved penalty. The quality of the penalties was different but not outstanding.
Based on the model it was expected that 35 per cent of the five penalties would have been saved, resulting in 1.75 expected saves. For the other shot he faced, the expected saves number was at 0.29.
So, in total, 2.03 saves would have been expected from Bergerud. In fact, he saved four shots, 97.3 per cent more than expected: a very good number but also obviously a small sample size.
Amongst goalkeepers who received at least 30 shots on goal, the Swede Johannesson overperforms the most compared to the number of saves that is expected from the shots he faced. In total, 12.8 saves were expected from the 46 shots on his goal, but he actually saved 18, an overperformance by 40.3 per cent. In second place comes his compatriot Thulin (36.2 per cent more saves than expected) ahead of Møller (30.9 per cent).

The top three is therefore the same as for the save percentage, only the order is different. Fourth place goes to Iceland’s Viktor Hallgrímsson, who has been outstanding in the last matches. After that, however, things get interesting.
The two Spaniards Rodrigo Corrales and Gonzalo Perez de Vargas have only average save percentages (29.5 per cent and 30.9 per cent respectively) but the defence in front of them allows too many good shots, so their performance is actually much better.

With Vincent Gerard, the opposite is the case. Despite his strong save rate, he actually saves 1.8 per cent fewer shots than expected from an average goalkeeper. France’s defence is just good and he faces many imprecise shots.
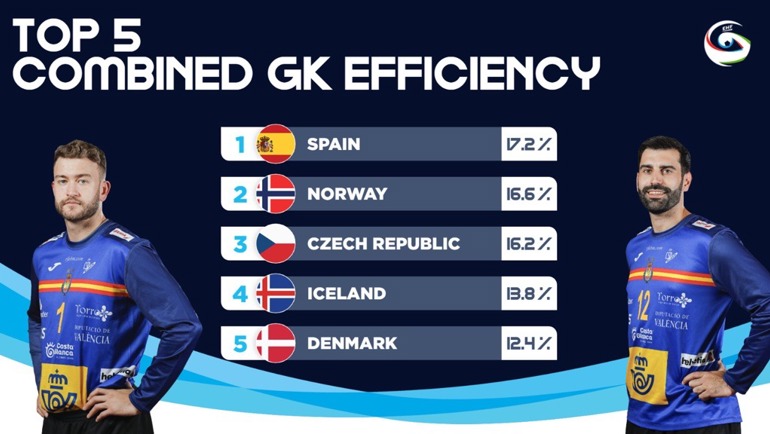
Since goalkeepers are often referred to as a team within a team, their combined performance can of course also be evaluated. Here, the Spaniards lead ahead of Norway (Bergerud +20.0 per cent, Kristian Saeveraas +9.9 per cent) and the Czech Republic (Tomas Mrkva +17.0 per cent). Sweden is only in sixth place, because although Johannesson and Thulin have outstanding numbers, most of the time Andreas Palicka was on the field, who had 3.6 per cent fewer saves than expected.
Due to the limited data available, the model is not yet perfect, but it is already more meaningful for goalkeeper evaluation than the save percentage. With more and more data being tracked the near future will bring great improvements here.
Julian Rux is a data analyst and data journalist. More of his work can be found on his website and blog Handballytics.de as well as on social media: Instagram, Facebook and Twitter


